Most small businesses don’t have a formal marketing budget, and that hurts growth. If I want marketing to help grow revenue, I need to set a budget from revenue first, split it by channel based on results, and review it every month.
Here’s the short version:
A quick example: if my business makes $1,000,000 per year and I set aside 12% for marketing, my budget is $120,000 per year, or about $10,000 per month.
A few numbers stand out:
If I had to boil the whole process down, it would be this: set a clear budget, fund the channels that drive leads and sales, keep tracking clean, and move money based on results.
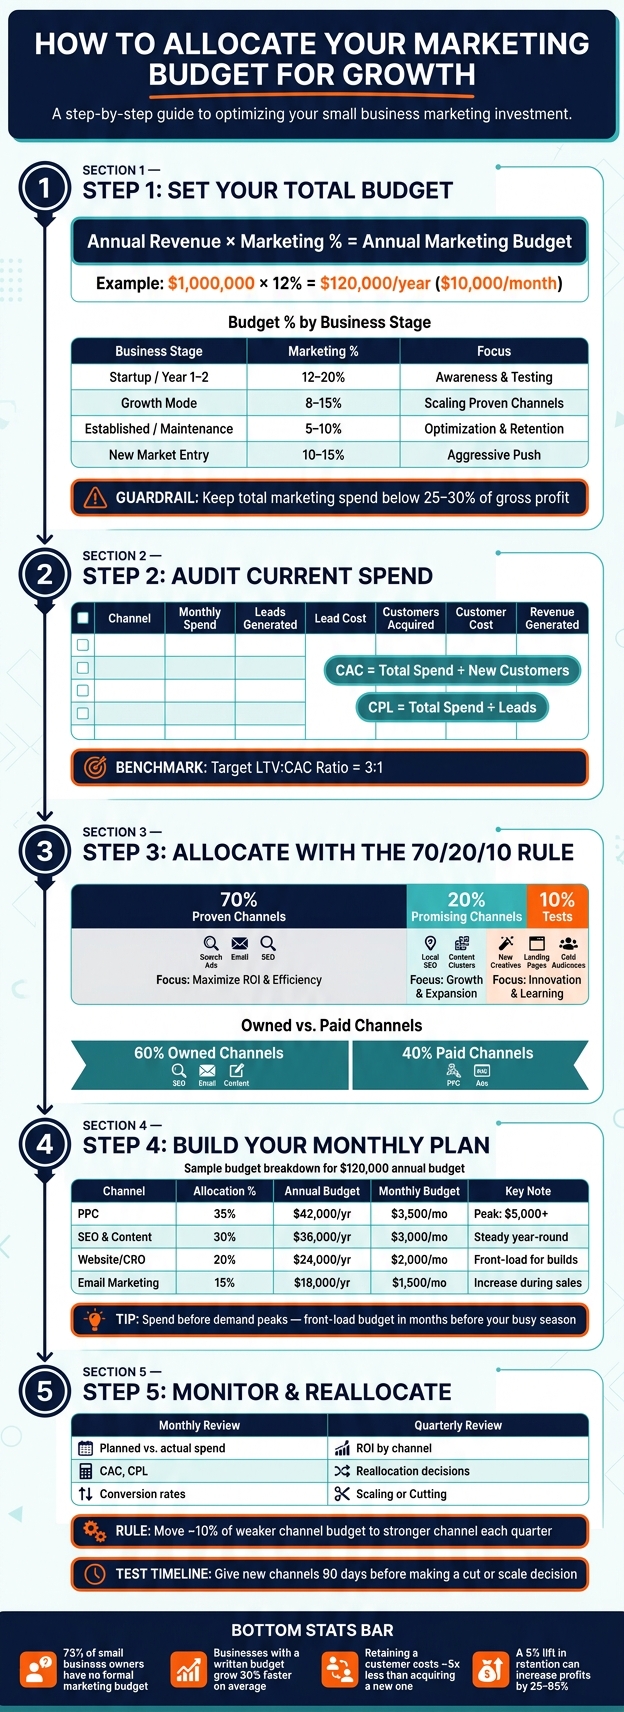
How to Allocate Your Marketing Budget: A Step-by-Step Framework
Start with the outcome. Pick the growth target you care about most: revenue, new customers, booked appointments, or expansion into a new U.S. market. That target should drive the rest of the budget, not the other way around.
Use the last 12 months of gross revenue as your baseline. If you don’t have a full year of data yet, use a grounded revenue forecast or your target revenue instead. That number becomes the base for your budget.
A simple formula is often enough to get started: Annual Revenue × Marketing Percentage = Annual Marketing Budget.
Here’s a practical starting range:
| Business Stage | % of Revenue | Strategic Focus |
|---|---|---|
| Startup / Year 1–2 | 12–20% | Awareness, testing channels, establishing presence |
| Growth Mode | 8–15% | Scaling proven channels, adding new ones |
| Established / Maintenance | 5–10% | Optimization, retention, defending market share |
| New Market Entry | 10–15% | Aggressive push, then taper once traction holds |
One guardrail matters here: keep total marketing spend below 25% to 30% of gross profit. If your net margins are below 10%, trim the percentage so you don’t squeeze profit too hard.
Think of these ranges as the upper limit, not an automatic spending target. The next move is to check whether your current channel mix can support that level.
Budget needs change as a business grows. Startups usually spend more because they need attention and demand at the same time. More established businesses tend to spend less as they shift toward tuning what already works.
Sales cycle length also affects the math. B2C businesses with shorter sales cycles often spend 9% to 12% of revenue. B2B companies with longer sales cycles often land closer to 6% to 9%. If you’re entering a new U.S. market or launching a new product, that number may need to jump for a while to 10% to 15% or even 20% to build early awareness.
Seasonal businesses need a different rhythm. In that case, it makes sense to front-load spend before peak demand hits.
Once the total budget is set, compare it with current channel performance before moving dollars around.
Before you move budget around, look at what you’re already spending and what it’s doing for you. Start with your current budget, then check which channels are driving return right now.
Put every marketing expense into one spreadsheet. That includes freelancer fees, agency retainers, software subscriptions, ad spend, content tools, design subscriptions, hosting, and CRM or email tools. Then group those costs by function: branding, website, SEO, ads, social, content, and email.
A simple audit spreadsheet should include:
This makes it much easier to connect each cost to an outcome like traffic, leads, conversions, authority, or retention.
Once your costs are mapped out, add performance data for each channel. Pull it from Google Analytics, ad platforms, CRM source fields, and call tracking so you can see what each source is producing.
The main numbers to track are Customer Acquisition Cost (CAC), Cost Per Lead (CPL), conversion rate, and revenue by source. The formulas are simple:
Here’s where people get tripped up: a low CPL can look good on paper, but it doesn’t mean much if those leads never turn into customers. When you compare channels, put more weight on CAC than CPL.
A solid benchmark is an LTV-to-CAC ratio of at least 3:1. In plain English, customer lifetime value should be at least three times higher than what it costs to acquire that customer.
To get clean numbers, use UTM parameters, CRM source fields, and call tracking so every lead can be traced back to a specific source. If you can’t connect leads or customers to a channel, that’s a tracking gap, and it’s costing you budget.
Once cost and performance sit side by side, the next step gets a lot clearer. Use the 70/20/10 rule to guide budget shifts: 70% of the budget goes to proven channels, 20% goes to promising channels, and 10% goes to tests.
If budget gets tight, protect SEO and content before cutting paid ads. Unlike ad spend, those channels can keep paying off over time because they build compounding assets.
Use the audit to sort channels into three buckets: keep funding, reduce spend, or move into test mode. That gives you a practical base for the monthly and quarterly reallocations that come next.
Now that the audit is done and weak spend has been spotted, the next move is simple: decide where the money should go. Don’t split budget evenly across channels. Split it based on funnel role. Start with the channels you kept from the audit, then assign budget according to what each one is supposed to do.
Break your spend into three buckets:
If you’re a small business chasing near-term growth, you’ll usually put more weight on conversion-focused channels like PPC and website optimization. Why? Because they can drive leads faster.
But going all-in on conversion and starving awareness or retention is a bad trade. Retention deserves protection. It costs about 5x less to keep a customer than to get a new one, and a 5% lift in retention can increase profits by 25% to 95%.
A solid starting point for a growth-stage business is to put about 60% of the budget into owned channels that build over time, like SEO, email, and content, and 40% into paid channels for near-term lead flow. From there, adjust based on one thing: how badly you need revenue now versus how much time you have to build long-term assets.
The 70/20/10 rule gives you a clean way to handle risk inside each funnel stage.
Put 70% into channels that are already working. That might be search ads that keep producing leads, email sequences with solid open and conversion rates, or SEO that’s starting to move.
Use 20% for channels or plays that show promise but need more fuel. Think local SEO expansion or new content built around additional keyword clusters.
Keep the last 10% for testing. A new landing page. Different ad creative. A short-run offer sent to a cold audience.
That setup keeps most of your spend in safer territory while still giving you room to find the next thing that works.
Before you start assigning percentages, get clear on each channel’s job.
Your website and tracking come first because they support conversion. After that, fund SEO and content, then paid ads. Email should also stay funded because it’s often your highest-ROI retention channel.
Here’s the hard truth: sending paid or organic traffic to a weak site is like pouring water into a leaky bucket. If the website isn’t built to convert, that spend gets wasted.
The table below lays out the four core channels using the factors that matter most when you’re deciding where each dollar should go:
| Channel | Time to Impact | Cost Profile | Measurability | Scalability | Best Use Case |
|---|---|---|---|---|---|
| PPC (Google Ads) | Immediate | High (pay-per-click) | High | High | Active search intent; fast leads |
| SEO | 4–9 months | Moderate (labor/content) | Moderate | High | Long-term traffic growth; lower CAC over time |
| Website/CRO | Immediate (after launch) | High (upfront) | High | Low | Turning traffic into leads; the conversion foundation |
| Immediate | Low (platform fees) | High | Moderate | Retention, lead nurturing, high-ROI sales |
Use these roles and timelines to set monthly percentages in the next step.
Channel percentages don’t mean much until you turn them into monthly dollar amounts. That’s when the plan gets tied to actual spend, not just a spreadsheet. Use those percentages to set monthly targets and minimum spend levels so the budget stays grounded.
Start with a simple baseline: divide the annual budget by 12. Then adjust that number for seasonality so you spend more in the months leading up to peak demand. A landscaping company is a good example. It should put more money into February and March to lock in bookings before the April–October season starts. The key idea is simple: spend before demand peaks.
After you map out the peak months, apply that same monthly structure to both baseline spend and test spend.
When cash gets tight, it’s easy to slash everything at once. That’s usually a mistake. Try not to cut the marketing services that keep producing leads over time: SEO, website maintenance, content creation, and email nurturing. Those channels can keep working even when paid campaigns are paused.
If you have to reduce spend, cut paid ads first. They’re the most flexible budget line because you can pause them fast and turn them back on later.
The table below shows one way to spread a $120,000 annual budget across the year. Use it as a starting point, then adjust the mix based on channel performance and seasonality.
| Channel | Allocation % | Annual Budget | Avg. Monthly | Peak-Season Adjustment |
|---|---|---|---|---|
| PPC | 35% | $42,000 | $3,500 | Increase to $5,000+ during high-demand months |
| SEO & Content | 30% | $36,000 | $3,000 | Keep steady year-round |
| Website/CRO | 20% | $24,000 | $2,000 | Front-load during site builds or redesigns |
| Email Marketing | 15% | $18,000 | $1,500 | Increase send frequency during sales periods |
Track each month against these targets, then move dollars based on results.
After you set your monthly allocations, the next step is simple: follow the numbers and move money toward the channels that pay off.
Start by comparing planned spend vs. actual spend for each channel. Then look at three core metrics:
For small businesses, a healthy benchmark is an LTV-to-CAC ratio of at least 3:1. If a channel’s ROAS falls short of your margin target, reduce it or cut it.
| Review Frequency | What to Check |
|---|---|
| Monthly | Planned vs. actual spend, CAC, CPL, conversion rates |
| Quarterly | ROI by channel, reallocation decisions, scaling or cutting |
Once the monthly numbers come in, make budget shifts in small steps. Big swings can throw off performance and make it harder to see what’s working.
If a channel hits or beats your target CAC, increase its budget gradually. And if one channel keeps bringing in leads at a lower cost than another for the same customer type, move about 10% of the weaker channel’s budget to the stronger one each quarter.
Also, cut spend tied to impressions or follower counts when those numbers don’t connect to leads or revenue. Vanity metrics can look good on a report, but they don’t pay the bills. Put that money into channels with a clear path from click to conversion.
When you’re testing a new channel, give it 90 days with solid tracking before making a call. Then use the data to decide whether to scale it, keep it flat, or cut it in the next quarter.
Review monthly, reallocate quarterly, and keep funding the channels that produce revenue.
There’s no one set percentage that works for every business. A lot of small businesses put 5% to 10% of gross revenue into marketing. Startups often need more room to push for growth, so they may spend 12% to 20%. More established businesses can often do well in the 4% to 7% range.
The right number depends on where you want to go, how much margin you have, and how tough your market is. One more gut check matters here too: your customer acquisition cost should stay well below customer lifetime value, with an ideal ratio of 3:1 or better.
Don’t let missing historical data freeze your decisions. Start with rough industry benchmarks to set an opening budget, then use your first 90 days as a testing window.
Begin with a solid tracking setup, including website analytics and call tracking. After that, invest a fixed amount you can afford to maintain so you can gather real numbers and adjust your approach based on what your own data shows.
Cut a channel when the numbers just don’t work. If a proper test shows no measurable return, misses your performance targets, or leaves you unable to connect spend to revenue, it’s time to pull back. Any paid channel that fails to hit at least a 2:1 return on ad spend should move to the top of the cut list.
That said, don’t kill a channel too early if it sits in your test mix. Give it enough room to prove itself. Run the test for at least 6 weeks, stay committed for 90 days, and set aside 10% to 20% of your budget for experiments.


 Physical Therapy
 MedSpa
 Dental
 HVAC
HVAC Roofing
 Pest Control
 Cleaning Services
 Landscaping
 Hotel
Hotel Cruise
 Branding
 Content Marketing
 Email Marketing
 Graphic Design
 PPC (Online Ads)
 SEO (Search Engine Optimization)
 Website Design and Development
 Pest Control